
All findings · Arctic Open-Water Window
How did Barrow Strait change between the first and last decade?
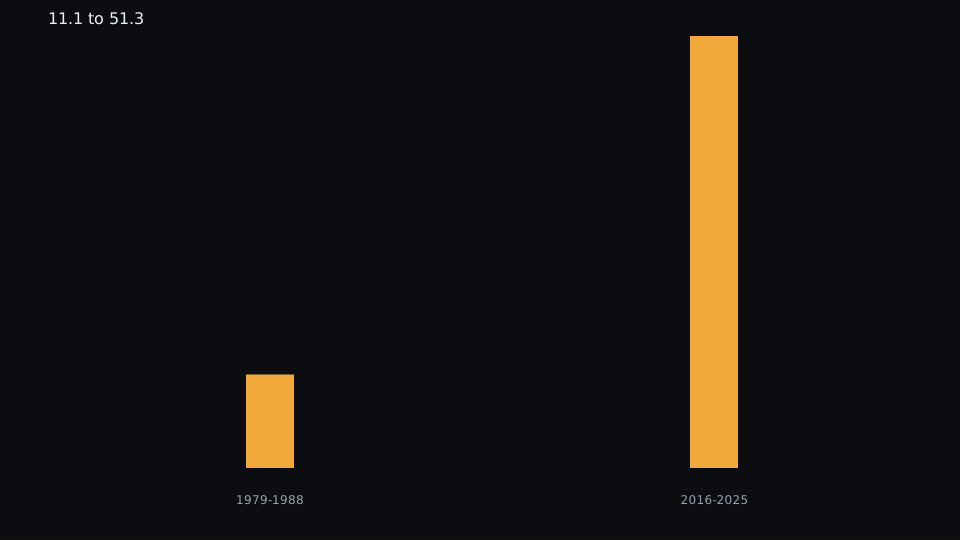
Barrow Strait, Canada: 11 open days a year in 1979-1988, 51 in 2016-2025.
At Barrow Strait, mean open days at the 15 percent cutoff rose from 11.1 days a year in 1979-1988 to 51.3 days in 2016-2025 (difference +40.2 days).
These numbers are Arctic Open-Water Window version 1.1, the published package (15 gates in version 1.1).
Chart
From the table
Reading
What the data shows
For nwp-barrow, mean open_days_15 on full seasons with a numeric value is 11.1 in 1979-1988 (n=9) and 51.3 in 2016-2025 (n=10). The difference is +40.2 days.
Context
Why it matters
Barrow Strait is a gate on the Northwest Passage in the Canadian Arctic. The gate table places it between 74.0 N and 74.7 N, and between 94.8 W and 91.3 W. Utqiagvik, Alaska, is a different place. 1984 is left out of the early mean because open_days_15 is blank (46 missing days). An open day is a day when the average sea-ice concentration inside the polygon is below 15 percent. Ice thickness and a ship route are outside this table.
Method
How it was measured
An open day is a day when average sea-ice concentration inside the gate polygon sits below the cutoff named in open_days_15. Partial seasons are left out. The early window is 1979 through 1988. The late window is 2016 through 2025. The difference is the later mean minus the earlier mean. This page is the nwp-barrow rows. Early-decade means skip seasons with blank open_days_15. Method on the dataset page.
Limits
What this cannot tell you
Polygon average concentration, not ice thickness or a ship route. The 15 percent cutoff is the strictest of the three. Provisional near-real-time days can change. Early-decade means skip seasons with blank open_days_15. Disclaimer word for word: Not for navigation. Use at your own risk. Provided as is, without warranty of any kind.
Check
Check it yourself
- File
arctic/gate_seasons.csv- Column
open_days_15- Row
gate_id nwp-barrow, partial not True, blank open_days_15 skipped, years 1979-1988 (n=9) and 2016-2025 (n=10)- API and assistant
- Same key, same data
This API call reads the same cells.
curl "https://api.heimdallresearch.com/v1/arctic/gates/nwp-barrow/seasons" \
  -H "Authorization: Bearer $HEIMDALL_API_KEY"
This assistant prompt asks for the same cells.
MCP https://api.heimdallresearch.com/mcp question: What is the mean open_days_15 for nwp-barrow in 1979-1988 and in 2016-2025, skipping blank values?Citation
Dataset citation
Heimdall Research (2026). Arctic Open-Water Window (Version 1.1) [Data set]. Zenodo. https://doi.org/10.5281/zenodo.23147722 Concept DOI https://doi.org/10.5281/zenodo.23021977. New version of https://doi.org/10.5281/zenodo.23021978.
- Version
- 1.1
- DOI
- 10.5281/zenodo.23147722
Related
Related findings
-
Vilkitsky Strait: 6 open days a year then, 83 now
At Vilkitsky Strait, mean open days at the 15 percent ice cutoff rose from 5.8 days a year in 1979-1988 to 82.6 days in 2016-2025 (difference +76.8 days).
Breakdown
For Vilkitsky Strait (nsr-vilkitsky), the mean of open_days_15 on full seasons with a numeric value is 5.8 in 1979-1988 (n=9) and 82.6 in 2016-2025 (n=10). That is a rise of 76.8 days. Seasons with a blank open_days_15 are skipped. An open day is a day when average sea-ice concentration inside the gate polygon sits below the 15 percent cutoff.
-
Vilkitsky Strait stayed shut in 8 early years. It opened every year from 2016 through 2025.
Vilkitsky Strait had 8 seasons with zero open days in 1979-1988 and 0 such seasons in 2016-2025.
Breakdown
In 1979-1988, 8 full seasons at nsr-vilkitsky have open_days_15 equal to zero. In 2016-2025, that count is 0. Blank open_days values are not counted as zero.
-
Bering Strait is open 53 more days a year than it was
At Bering Strait, mean open days at the 15 percent cutoff rose from 143.2 days a year in 1979-1988 to 196.5 days in 2016-2025 (difference +53.3 days).
Breakdown
For bering-strait, mean open_days_15 on full seasons with a numeric value is 143.2 in 1979-1988 (n=8) and 196.5 in 2016-2025 (n=10). The difference is +53.3 days. Seasons with a blank open_days_15 are skipped.
Not for navigation. Use at your own risk. Provided as is, without warranty of any kind.
Provided as is, without warranty of any kind.